SISMAL
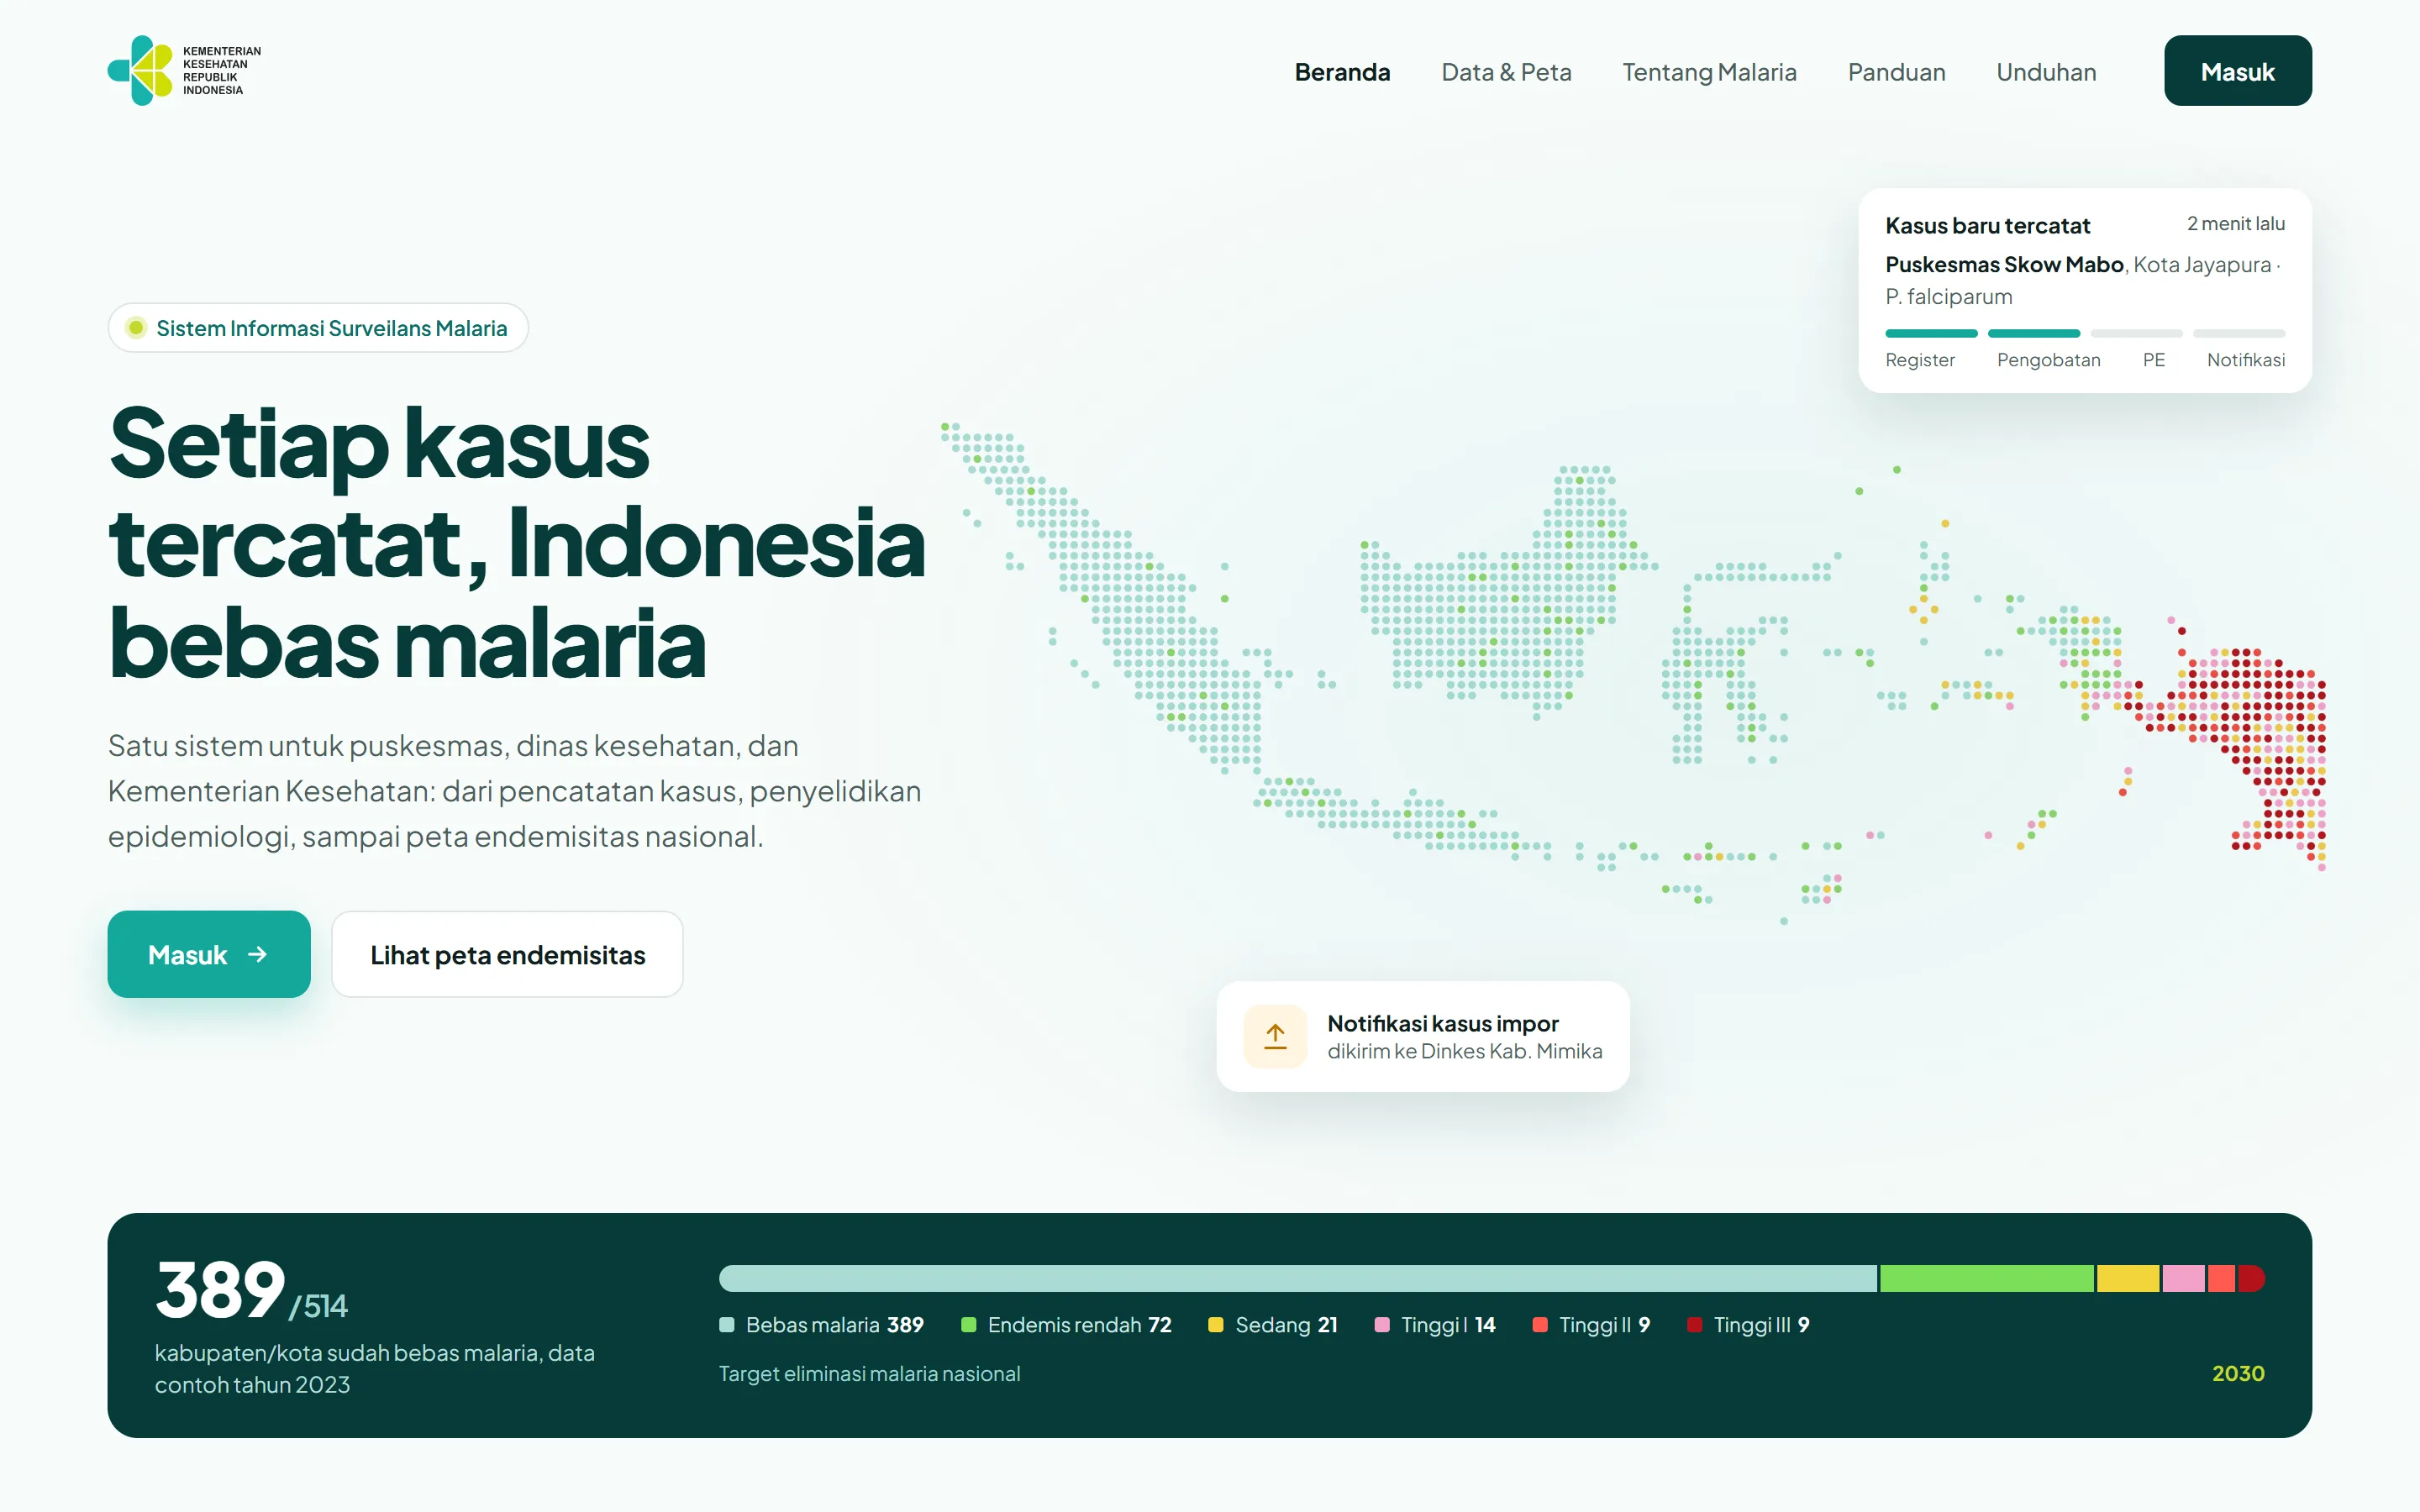
Malaria surveillance for Indonesia's Ministry of Health, from the first positive test at a puskesmas to the national endemicity map.
- UI/UX Designer
- Castellum Digital Indonesia / Ministry of Health
- 2024
- Figma
- Internal / not public

(01) — Context
Context & the challenge
SISMAL is the information system Indonesia uses to track malaria on the way to elimination. Most districts are already malaria-free, while parts of Papua and eastern Indonesia still carry most of the cases. To stay malaria-free, every positive case has to be recorded, treated, and investigated, so that a case brought in from another region does not start local transmission. I redesigned the modules that puskesmas, district health offices, and the ministry use every day. Health workers enter data on busy days, often on slow connections, into long forms. A case also has to be followed after diagnosis: a referral to hospital, an epidemiological investigation, and a notice to the region where the infection came from. The goal was to make each of these steps clear and connected to the same case.
(02) — My role
My role
I worked on SISMAL as a part-time UI/UX Designer at Castellum Digital Indonesia, for the Ministry of Health. I redesigned the malaria surveillance reporting dashboards used by puskesmas, district health offices, and the ministry to make reporting easier. Across the project I built the design system, ran usability tests, and handed off the designs to developers.
(03) — System
System logic & architecture
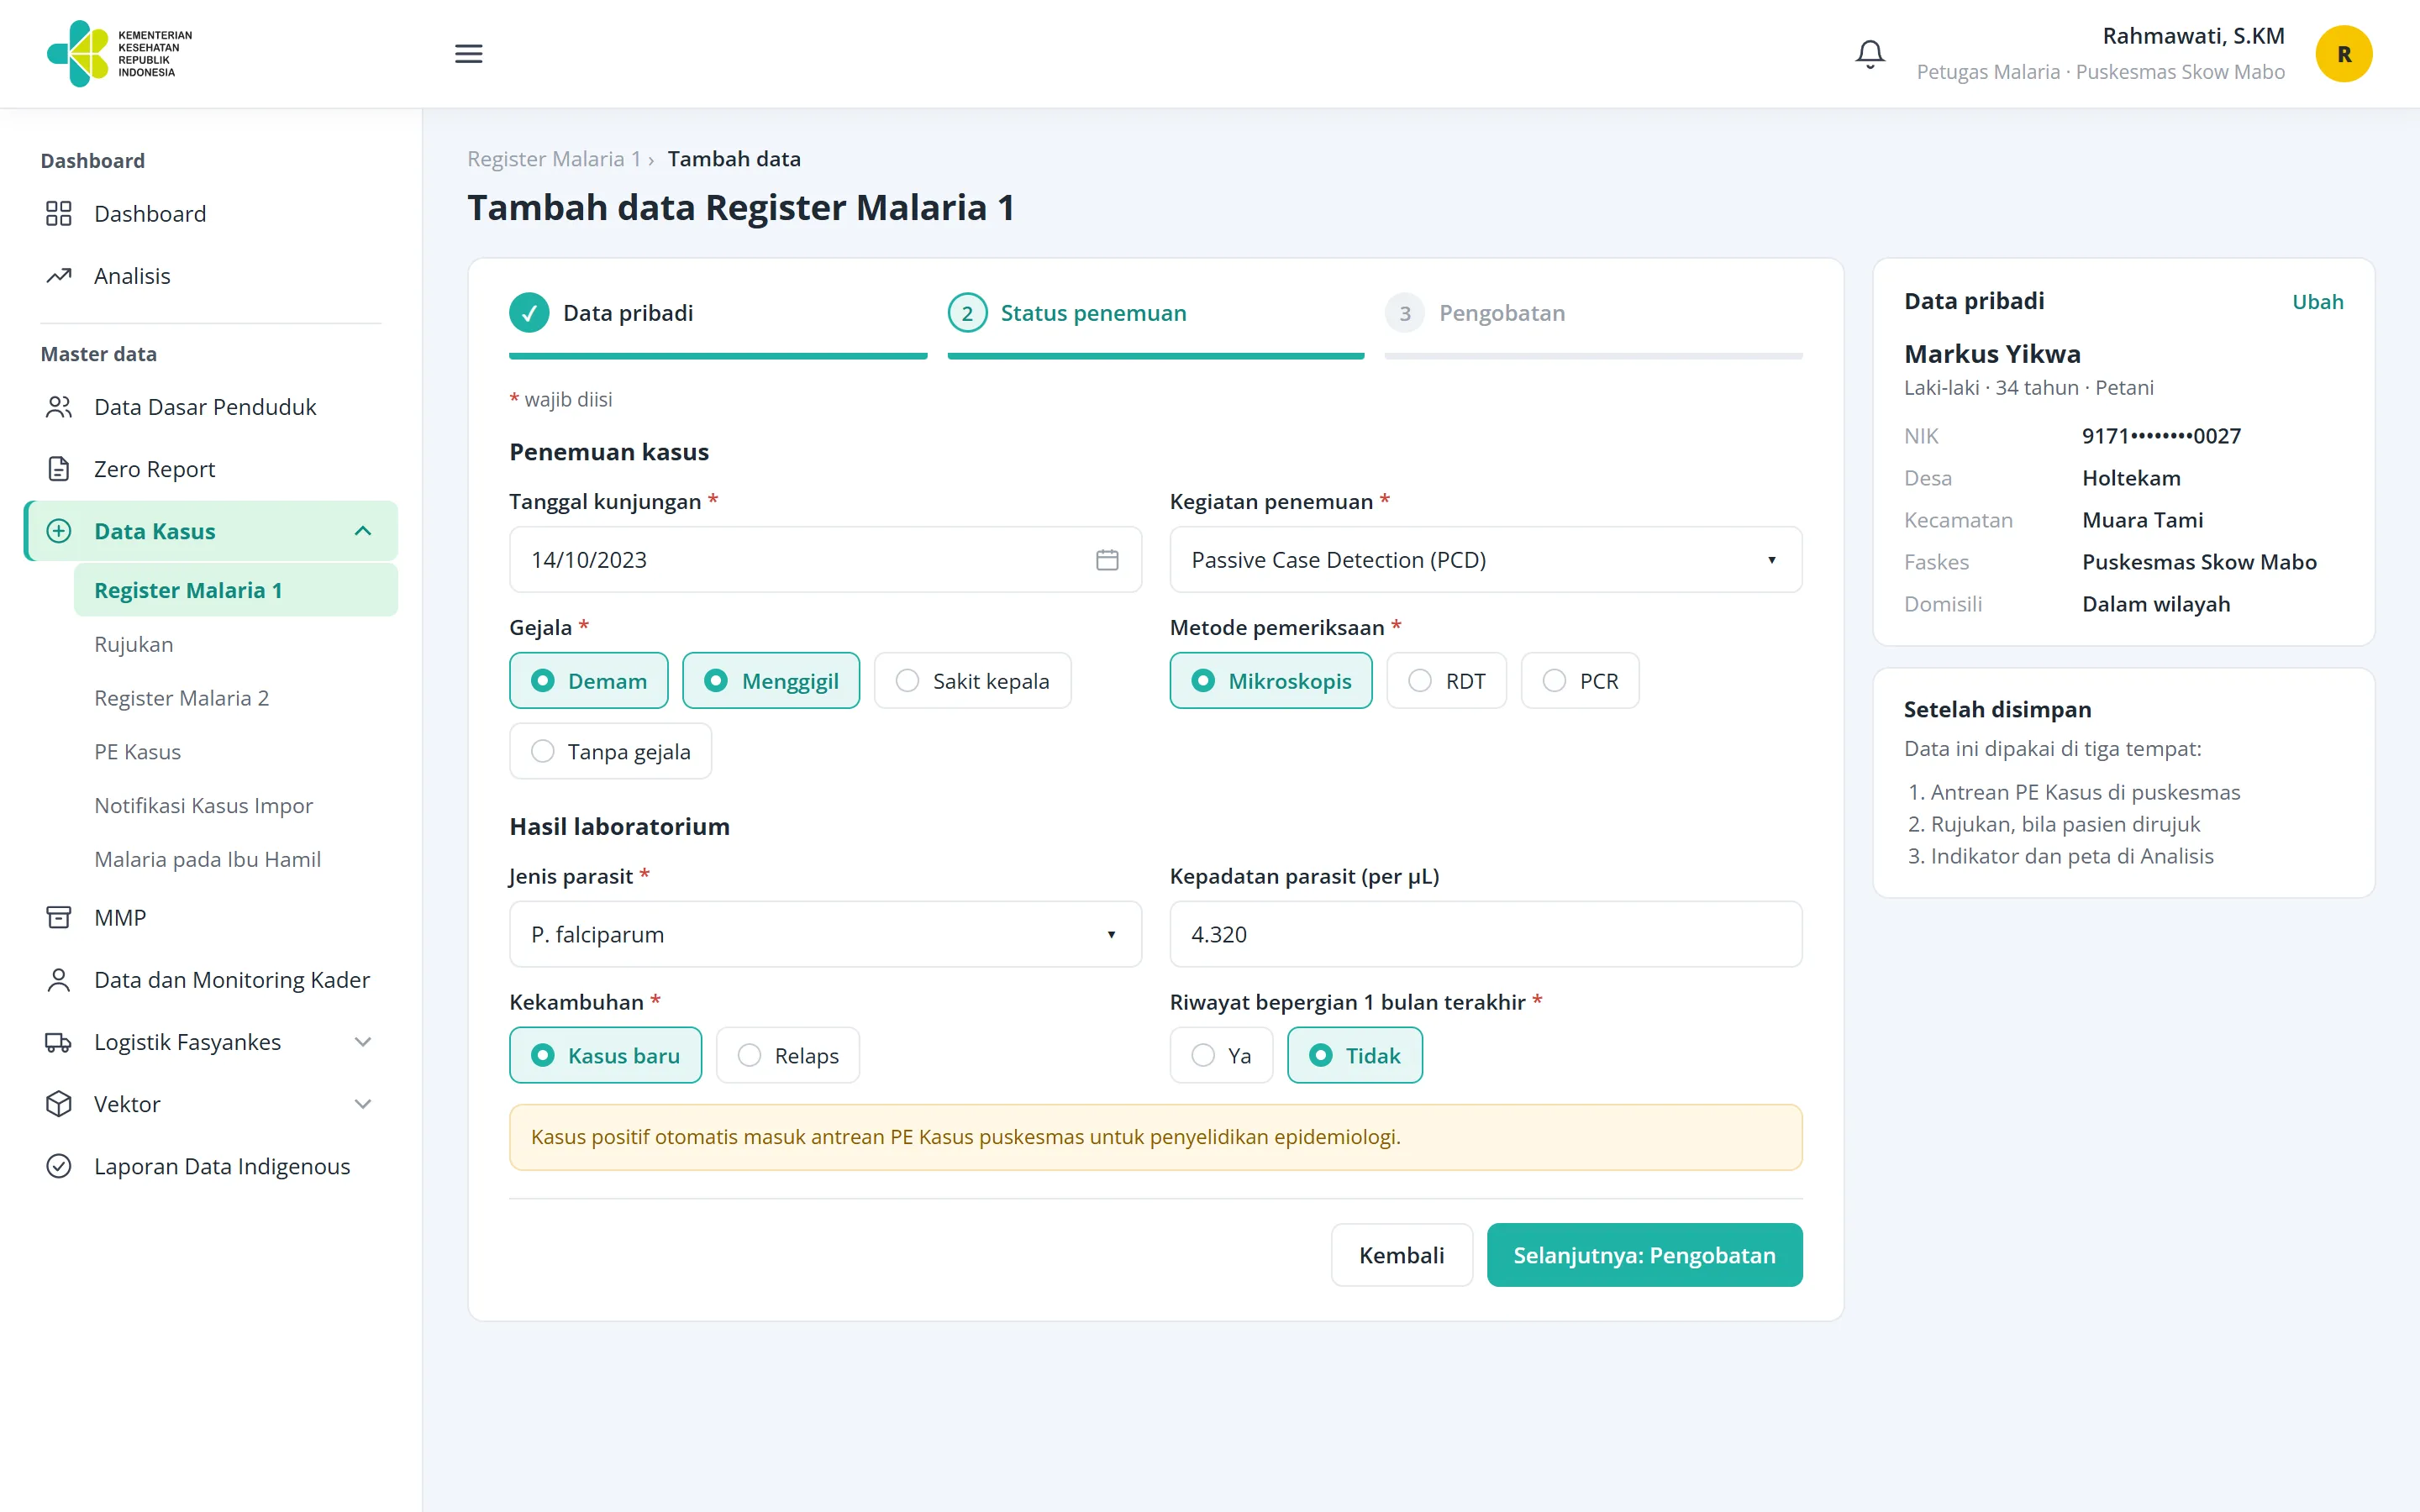
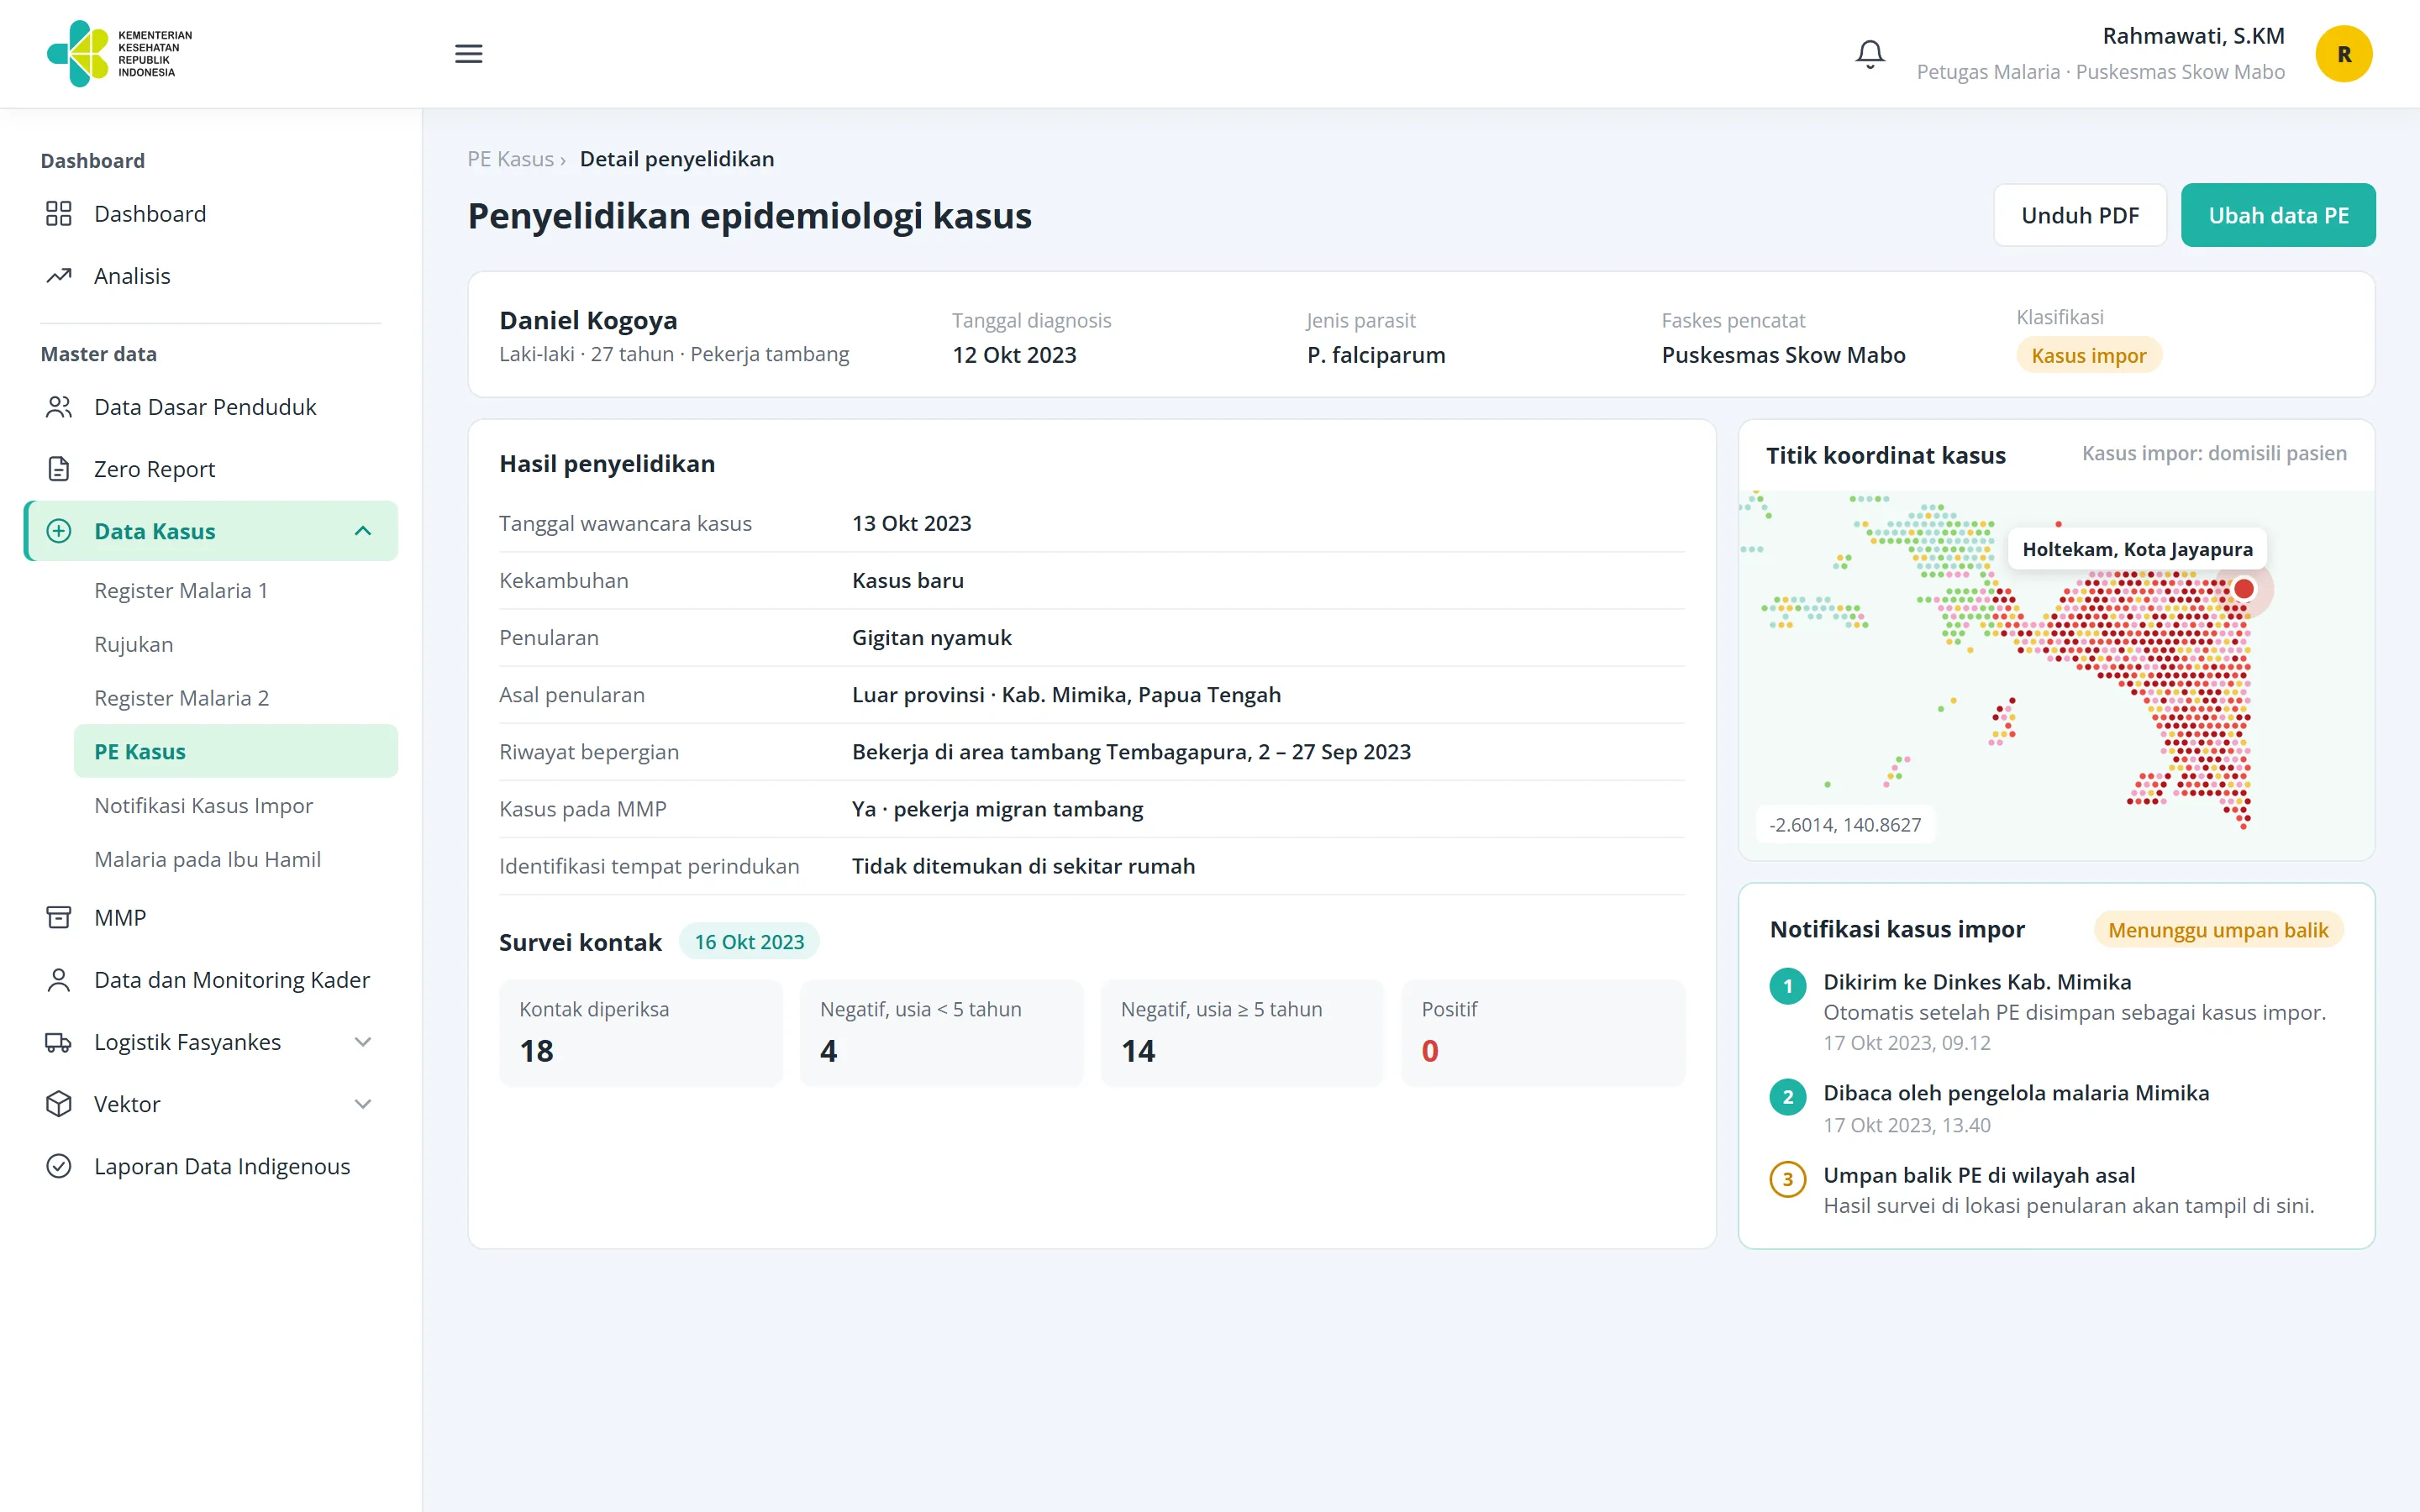
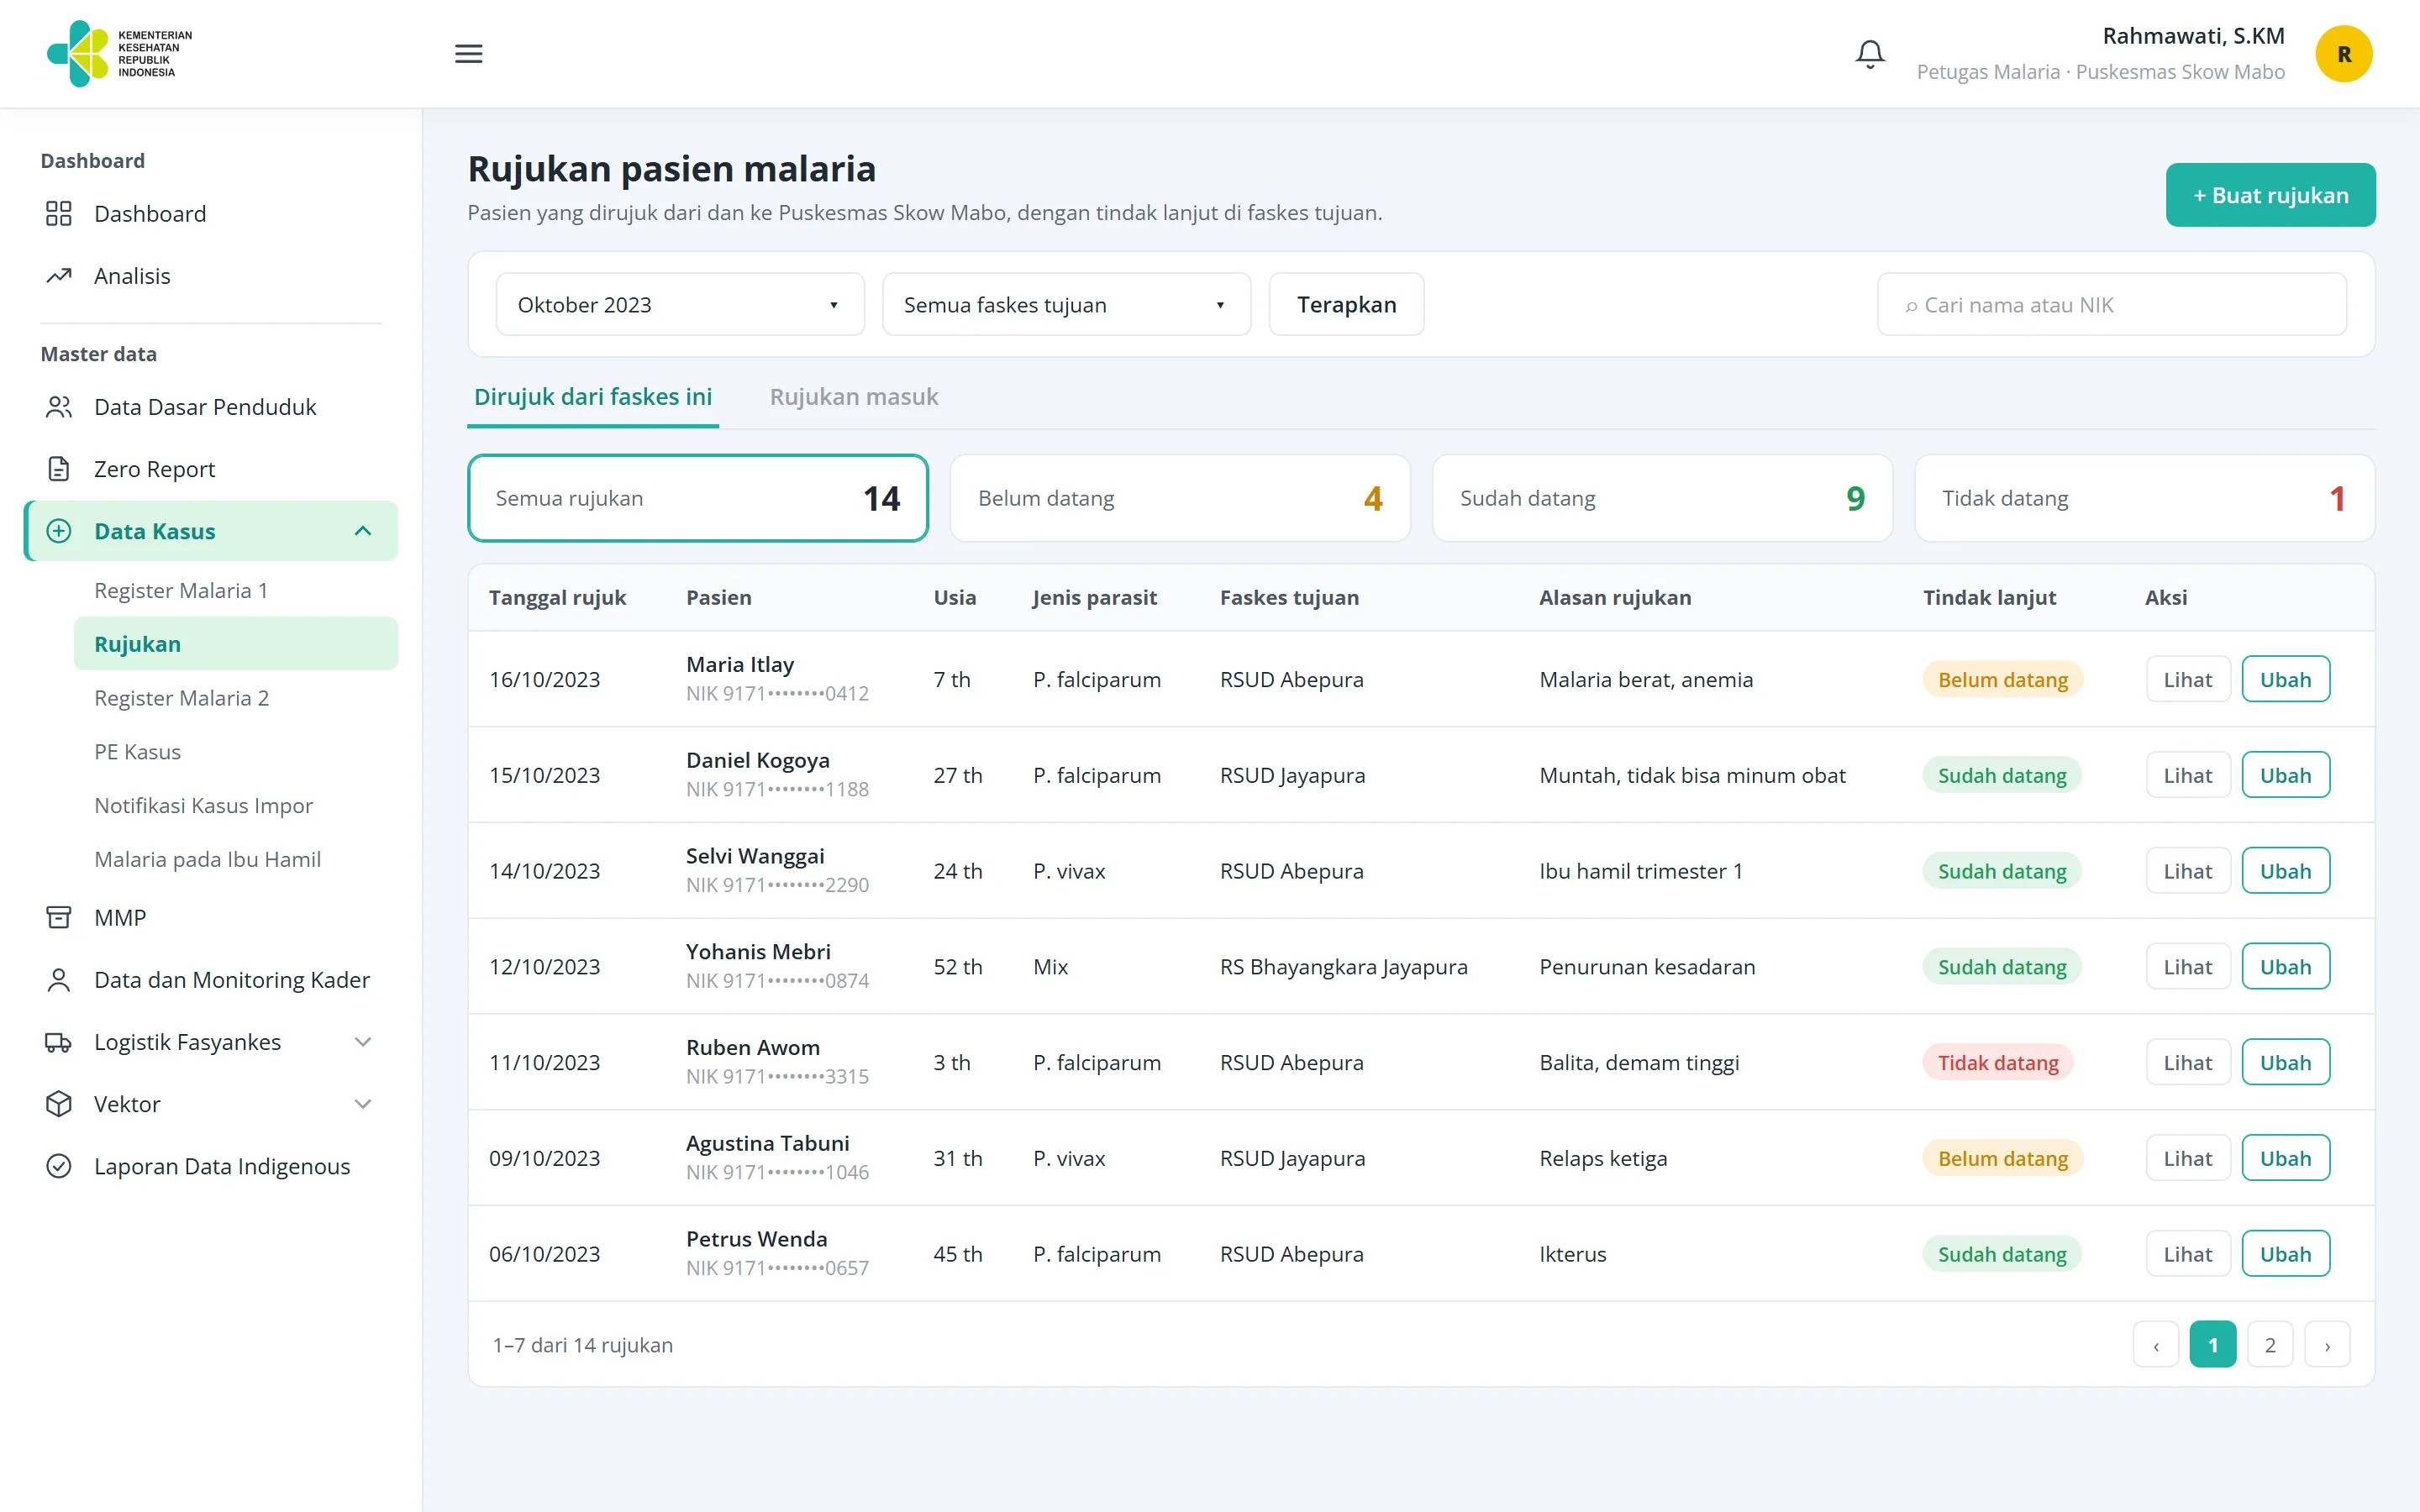
Everything starts from the case register. A puskesmas records the patient, how the case was found, the lab result and parasite type, and the treatment. A positive case then moves into the epidemiological investigation queue. The investigation records the contact survey, breeding sites, and where the infection most likely happened, and classifies the case as local or imported. An imported case sends a notification to the health office of the region of origin, which investigates there and sends feedback. Severe cases can be referred, and the receiving hospital records whether the patient arrived. Around this core sit population baselines and zero reports from facilities with no cases, mobile and migrant populations, cadre monitoring, drug and test stock with stock-out alerts, larva surveys, and malaria screening in pregnant women. All of it feeds the analysis module, where indicators and the endemicity map are read by district, province, or the whole country.
(04) — Features
Key features
The modules I redesigned across 14 Figma files, from data entry to analysis.
- Case registersMalaria Register 1 for individual cases in three steps, and Register 2 for facility-level reporting.
- Epidemiological investigationContact surveys, breeding sites, place of infection on a map, and local or imported classification.
- Imported-case notificationsAutomatic notices to the district of origin, with a feedback loop back to the reporting puskesmas.
- ReferralsOutgoing and incoming referrals with follow-up status: not yet arrived, arrived, or did not arrive.
- Programme dataPopulation baselines, mobile and migrant populations, cadre monitoring, larva surveys, and malaria in pregnancy.
- Logistics and analysisDrug and test stock with stock-out reports, plus indicators, graphs, and endemicity maps at every level.
(05) — Impact
Impact & outcomes
- modules redesigned, from case entry to analysis
- 14
- levels using one system, from puskesmas to ministry
- 3
- case record shared by register, investigation, and referral
- 1
The redesign connected the steps that follow a positive case, so a district can see which cases still need an investigation, a referral follow-up, or feedback from another region. Names and figures in these screens are sample data.